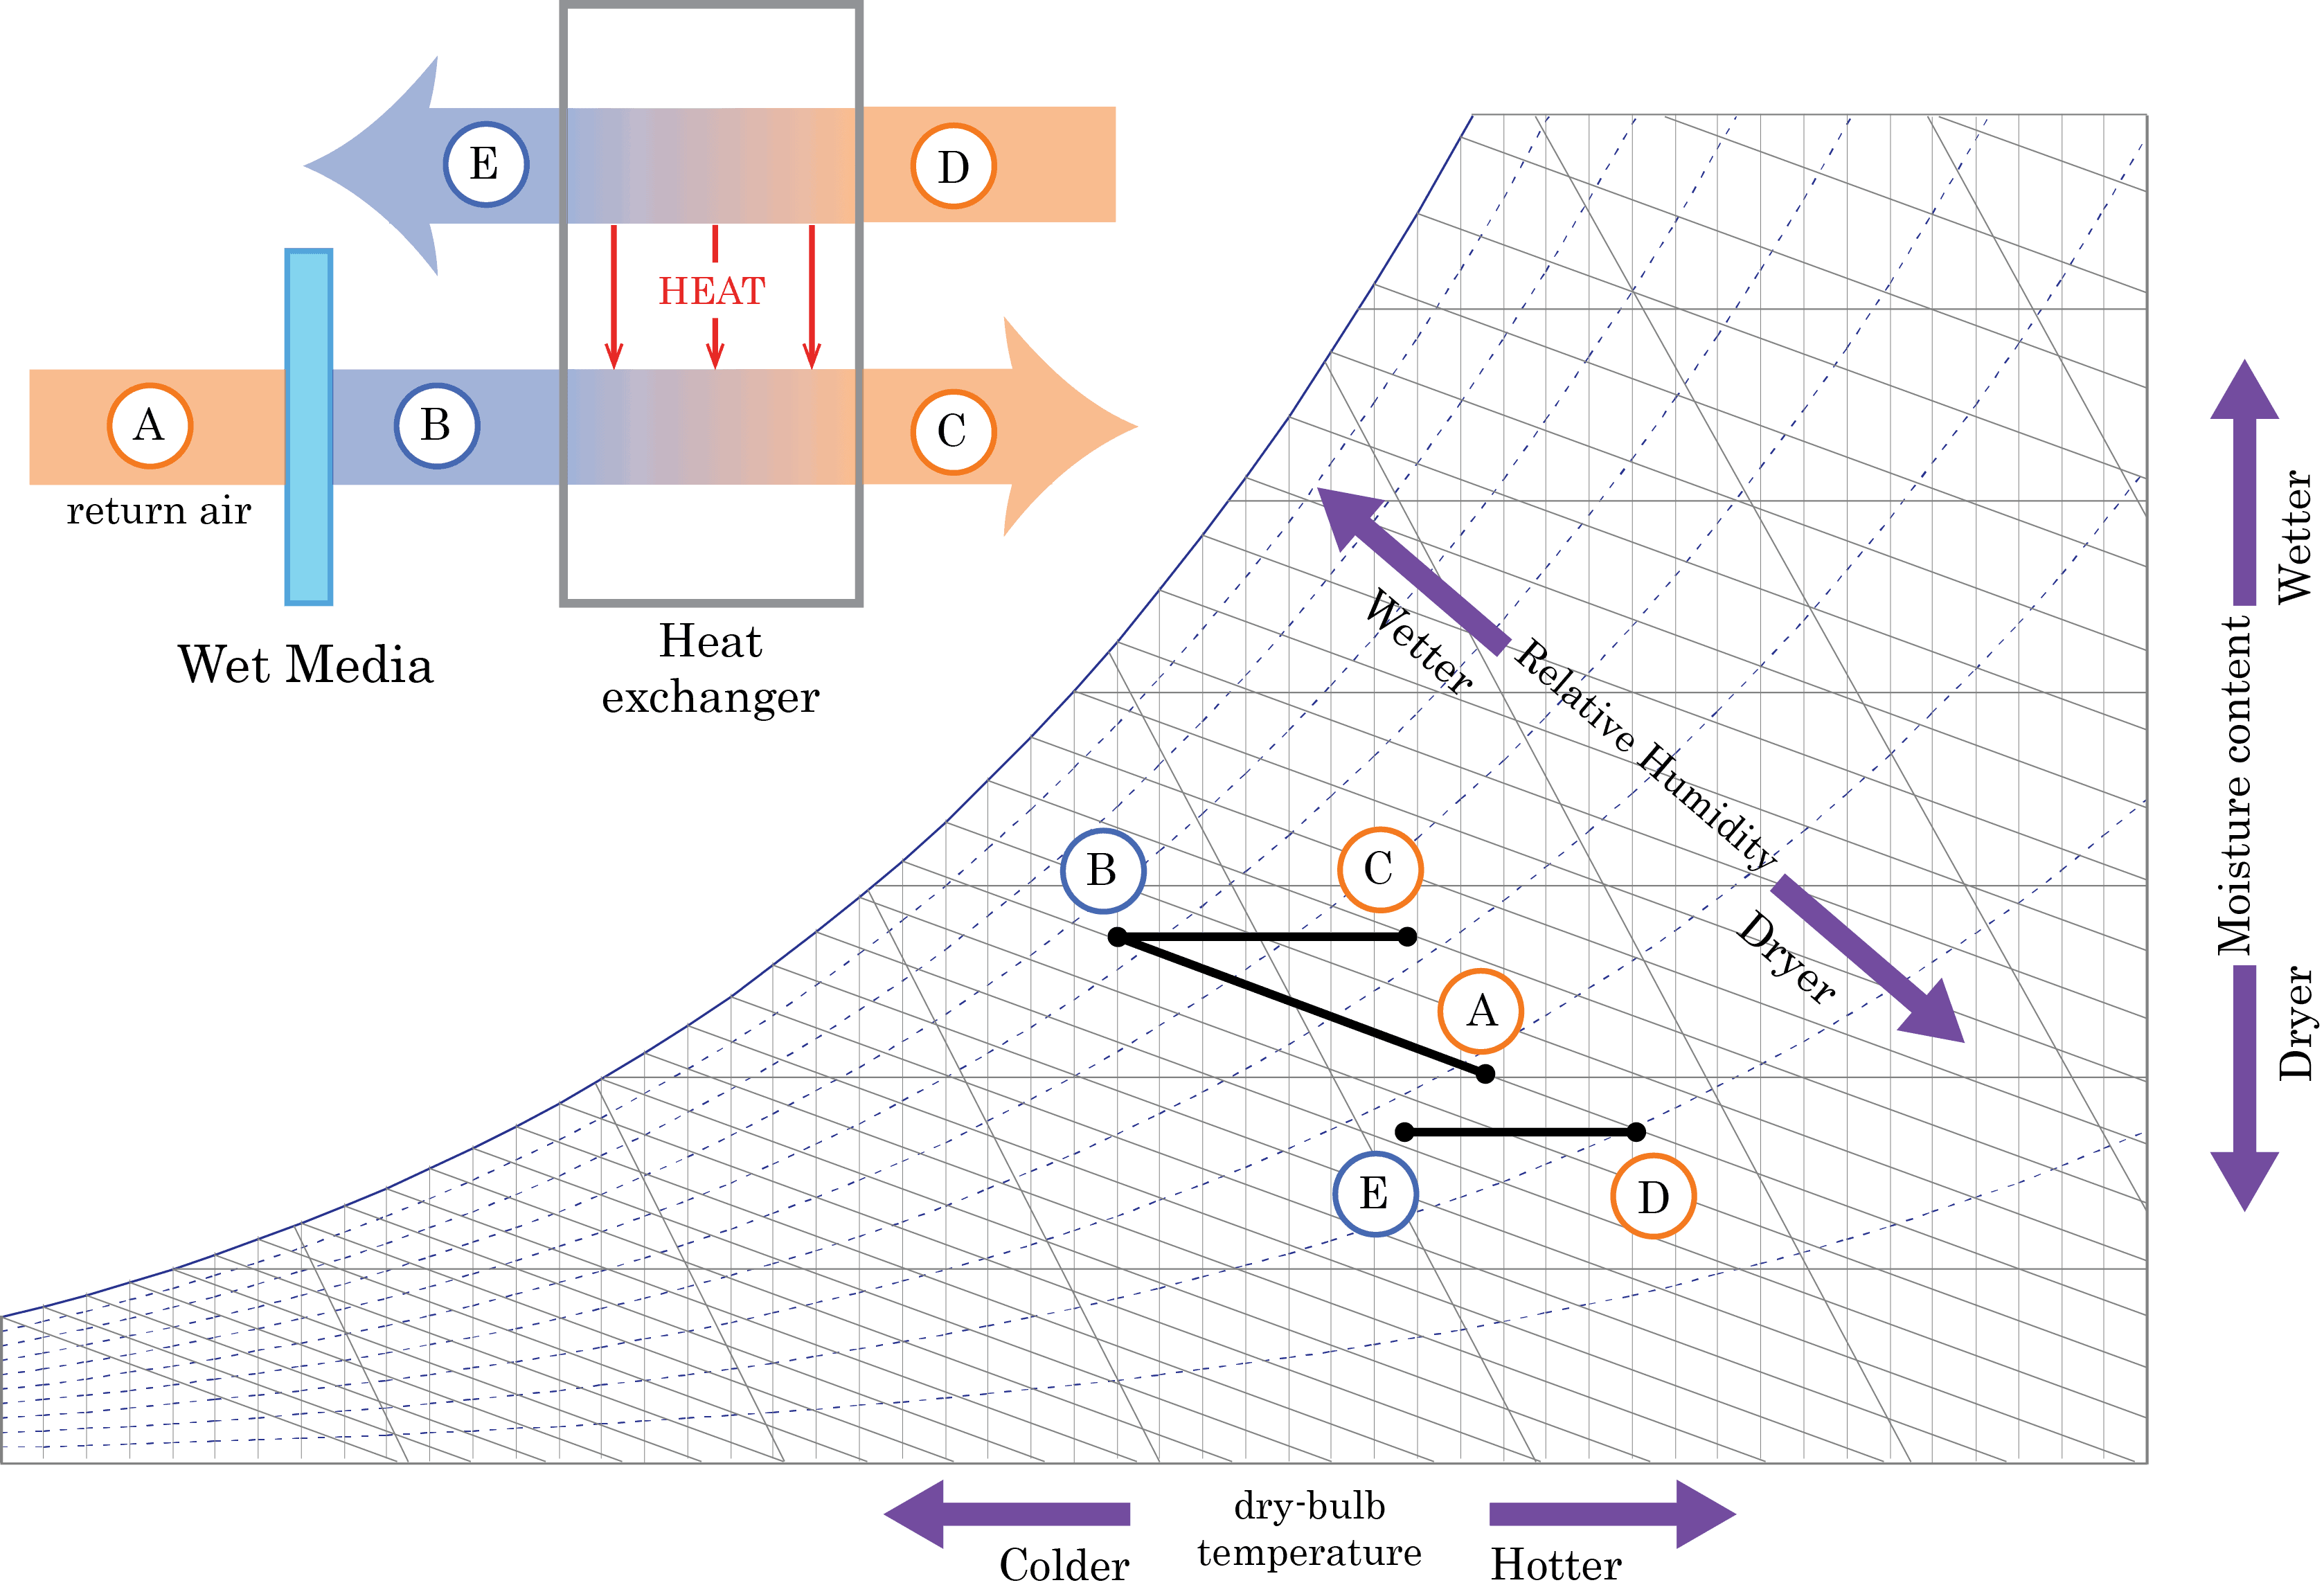
Psychrometric charts graphically depict changes in temperature and humidity within a given climate to help ensure efficient dehumidification procedures are implemented.
Air is never completely free of moisture, even in a desert, so monitoring the measurable properties of low-pressure water vapor enables climate control systems to better anticipate the output levels needed to produce users’ desired temperature and humidity.
Some properties monitored by psychrometric charts include:
- Dry bulb temperature (DB)
- Wet bulb temperature (WB; also known as saturation temperature)
- Dew point temperature (DP)
- Relative humidity
- Moisture content or humidity ratio
- Enthalpy or total heat
- Specific volume, which is the inverse of specific density
The dehumidification process maintains air at its dry bulb (DB) temperature constant while removing moisture. This process is represented on a psychrometric chart by drawing a straight vertical line that starts at the initial relative humidity value and extends downward to the ending relative humidity.

Psychometric Charts and Dehumidification
A climate’s dry bulb temperature increases as its dew point (DP) and wet bulb (WB) temperatures decrease. Psychrometric charts show this by drawing an angular straight line that starts at a given DB temperature and extends downward and rightward toward the ending DB temperature.
Dehumidification systems must constantly calculate the amount of moisture content to be removed from the air. However, in most cases, they only operate knowing the information for DB and relative humidity or the DB and WB temperatures, and therefore they must use psychrometric charts to triangulate proper airflow levels.
To achieve a suitable moisture content, chart users follow the lines of the two available variables and find the point where they intersect. From this point, following a horizontal line to the right leads you to the volume of moisture content to be eliminated. Once the user finds the starting and ending moisture content, they or their systems can calculate the volume of moisture to be removed.
Dehumidification Systems
Dehumidification systems use DB and DP temperature measurements to control relative humidity within their climate. This method provides a more accurate degree of moisture control than what can be reached based on a room’s relative humidity alone. This higher level of accuracy results from the fact that warm air holds more moisture than cool air, so a higher DB temperature with the same amount of moisture has a lower relative humidity.
Dehumidification systems operate based on these properties to optimize their moisture removal capabilities. Their design uses feedback from room temperature and humidity sensors to determine the most efficient operation mode. When the proper level of dehumidification has been reached, the system will stop removing moisture, but it will begin removing moisture again when it detects an increase in moisture levels.
Maintaining accurate psychrometric charts is necessary to calculate the proper volume of moisture to be removed from a dehumidification system’s area of control. A properly designed dehumidification system uses the parameters supplied by these charts to maintain precise moisture removal levels.
Optimize Your Internal Climate Control with DCA
Dehumidifier Corporation of America’s engineers bring years of experience to the dehumidification field. We’ve specialized in building quality dehumidification systems since 1995, using the most advanced technology in the industry to meet our clients’ needs at competitive rates.
Contact us to learn more about how DCA’s experts can assist you with your next dehumidification project.


